 This post continues my Defense Base Act Industry Report Cards series. The first post, which I uploaded last week, can be found here. To recap, the Department of Labor’s Division of Longshore and Harbor Workers’ Compensation (“DLHWC”) creates “report cards” for the large insurance carriers offering Defense Base Act insurance. The DLHWC focuses on timeliness of reporting the injury and timeliness of paying benefits.
Personally, I prefer looking at this information in line graph format. As such, I took the report card information on the DLHWC’s website and rendered insurer-specific line graphs. DLHWC shares the following information on its website:
The First Report data, aggregated by insurance carrier, shows the percent of reports received in the DLHWC District Offices within 30, 60, and 90 days of the date of the injury or death, or the date of the employer’s knowledge of the injury and the onset of disability, whichever is later. Similarly, the First Payment data, aggregated by insurance carrier, shows the percent of first payments issued within 30, 60, and 90 days after the worker becomes disabled for work or after the worker’s death.
In the last post, I discussed the reporting and payment trends of ACE American Insurance Company and AIG. Today, I discuss AWAC and CNA.
Allied World Assurance Company (“AWAC”):
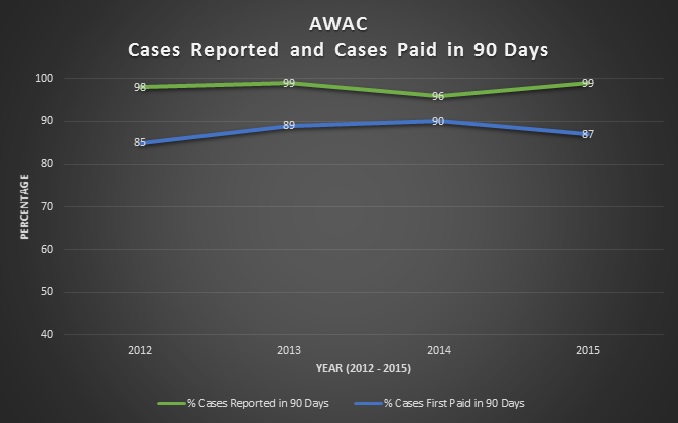
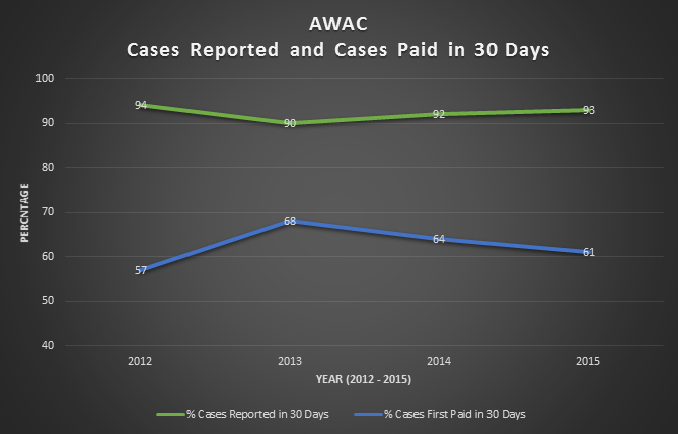
The line graphs for AWAC are shorter–meaning that they include fewer years–than those for the other insurance companies. AWAC entered the DBA insurance game later than its competitors. As such, the graphs cover four years: 2012 through 2015. When compared to the data reported by the other DBA insurance companies, it is apparent that AWAC entered the DBA industry with high reporting percentages. AWAC did not have the same early growing pains. As for first payments occurring within 30 days, AWAC peaked in 2013 with 68% of reported cases paid. As of 2015, 61% of cases were paid within 30 days.
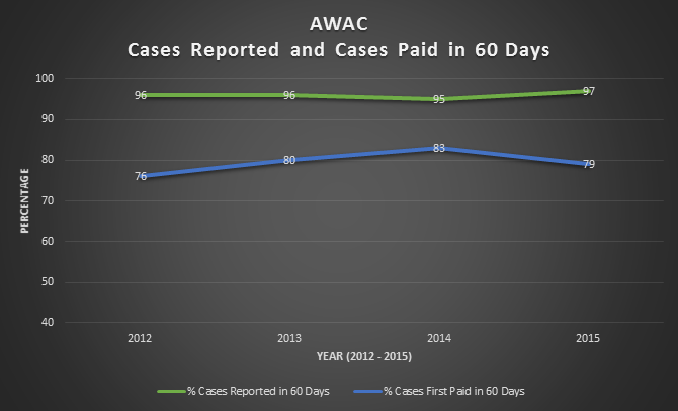
 The 60-day graph demonstrates that AWAC’s reporting percentages remained consistent from 2012 to 2015, with 95% to 97% of cases reported in 60 days. Further, the percentage of cases paid within 60 days falls between 76% and 83%, with the latter percentage achieved in 2014.
 The 90-day graphs remain consistent with the 30- and 60-day graphs. Notice how the reporting percentages remain constant but the number of cases paid between inception and 90 days steadily increase. The increase in percentages between the 30-day and 90-day graphs may demonstrate that AWAC’s cases are worked up in a consistent manner. In other words, each line graph shows a similar increase (year by year) in the number of cases paid within 30, 60 and 90 days. The payments made within 90 days falls between 85% and 90%.
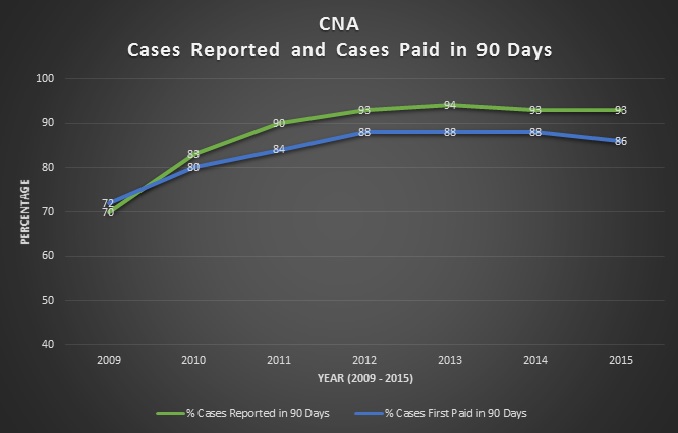
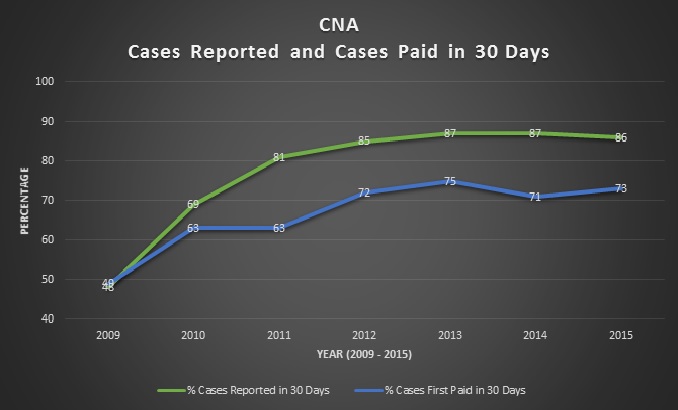
The reporting and payment information provided by CNA shows a positive increase in the reporting and payment percentages between 2009 and 2012. At that time, the percentages stabilized. Whereas CNA’s reporting and payment percentages were below the 50th percentile in 2009, the 2015 numbers show that 86% of cases were reported in 30 days, and 73% of cases were paid in 30 days. Although the reporting percentage is lower than other carriers, the payment percentage is higher.
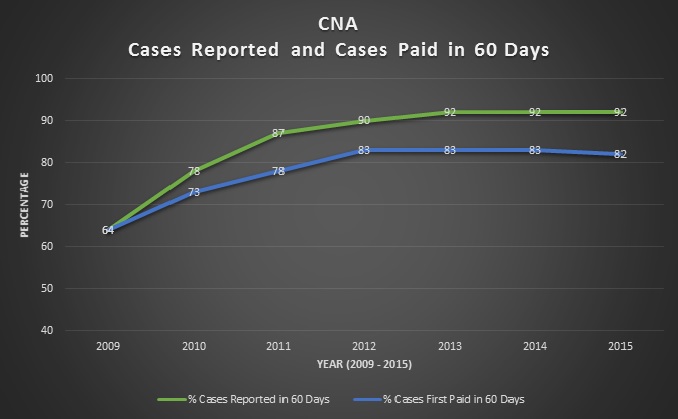
 The 60-day graph likewise shows normalization over the past five years. CNA’s reporting percentage fell between 87% and 92%; and CNA’s payment percentage fell between 78% and 82%.
 Finally, the 90-day graph starts with an interesting stat: a higher percentage of cases paid than there were cases reported. From there, however, CNA’s reporting and payment percentages stabilized between 90% and 93% (for reporting) and 84% and 88% (for first payments). Payment percentages over the last four years are comparable to AWAC’s 90-day graph.
